Lesson 5: Creating a Table Report
The Jinfonet Gourmet Java company receives orders from customers in different territories around the world, and by reviewing this shipping information the Shipping Department can receive bids from various shipping vendors. You are assigned the task of creating a shipment information report. In the report, the shipment details, including order ID, order date, ship date, shipping cost, whether the payment has been received, and the shipping vendor, need to be reported for each territory.
The following prototype of the report has been given to you:
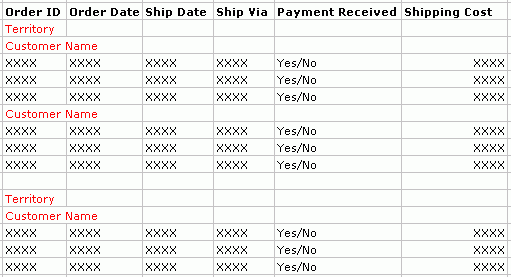
This report will be run online by employees in the Shipping Department. The interactive functionalities of Report page reports enable end users to change the view of the reports, filter the data, change the sort order, search the report, and so on. Each end user can get the data he needs from a single report.
Follow these tasks to create the report:
- Task 1: Create the Table
- Task 2: Add a Web Control to the Report
- Task 3: Add Objects and Edit Properties
Task 1: Create the Report
Before taking this task, make sure you have enabled the "Insert field name label with field" option in the Options dialog box as described at the last step of Lesson 3; otherwise, Designer does not insert the name labels together with the fields when you add fields to the table.
- In Designer, navigate to File > New > Page Report.
 Be sure that JinfonetGourmetJava.cat is the current catalog because this is the catalog we use in this track. For information about specifying this catalog, see Task 1, Steps 3 and 4 of Lesson 1.
 - In the Select Component for Page Report dialog box, select Table (Group Above) and select OK.
- In the Data screen of the Table Wizard dialog box, select <New Query...> in the Queries node of Data Source 1, type ShipmentDetailsbyCustomer in the Enter Query Name dialog box and select OK.
- In the Add Tables/Views/Queries dialog box, expand the JDBC connection node and then the Tables node, then select the tables Customers and Orders and select Add
 to add them to the query. Select OK to close the dialog box.
 - In the Query Editor dialog box,
the two tables are joined together automatically on the Customers_Customer ID and CustomerID_FK1 columns.
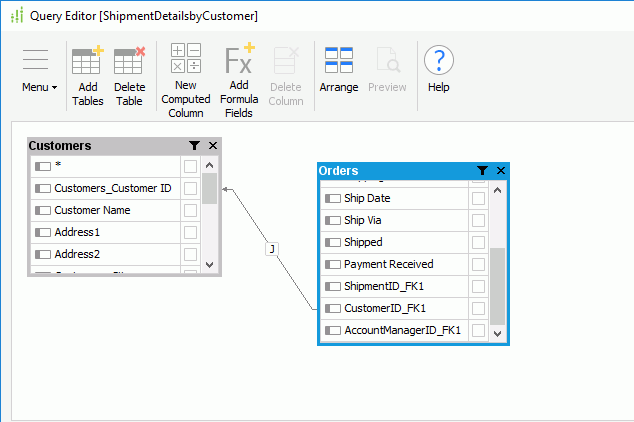
- Select all the columns in the Orders table by selecting * on the top. For the Customers table, select the following columns: Customer Name, Customers_State, Customers_Country, Customers_Territory, and Customers_Region.
- Select OK to create the query.
- Select Next in the Table Wizard dialog box.
- In the Display screen, drag the fields Orders_Order ID, Order Date, Ship Date, Ship Via, Payment Received, and Shipping Cost from the Resources box to the right box one by one.
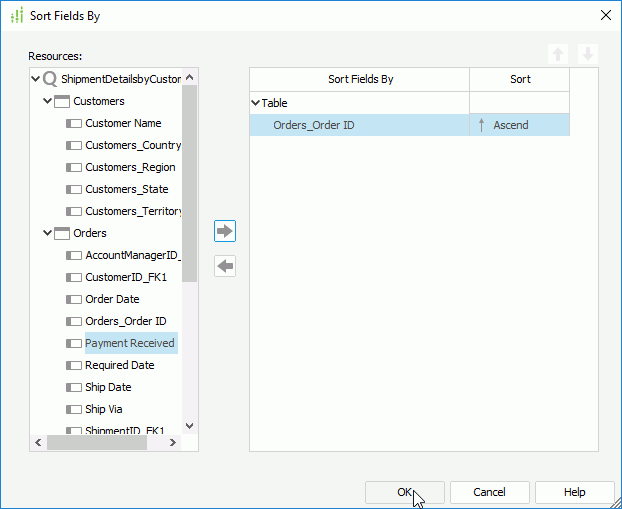
By default, Designer displays the records in a table in the order they are returned from the fetch operation. You can specify to sort the records in a table, and also within the groups in table if any. In this lesson, we sort the records in the table by order ID ascendingly.
- Select Sort Fields By.
- In the Sort Fields By dialog box, select Orders_Order ID in the Resources box and select Add
 to add it as the sort-by field, then select OK to return back to the Table Wizard dialog box.
-
Select Next to go to the Group screen.
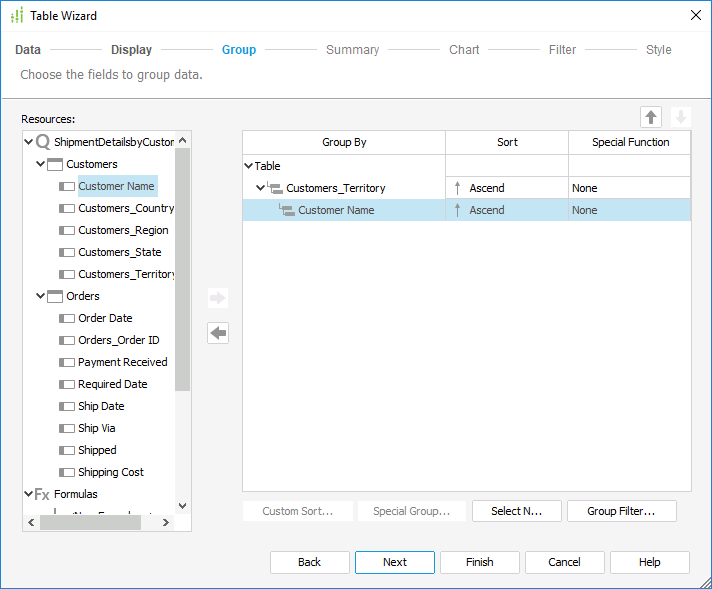
Since the report is required to display shipment details of each customer in specific territory, we need to add two groups to it: first group the report by territory and then by customer name.
- Add the DBFields Customers_Territory as the first group-by field and Customer Name the second one.
- Select Style on the screen navigation bar to switch to the screen and select to display the report in the Classic style vertically.
- Select Finish to create the report.
- Select the View tab to preview the report.
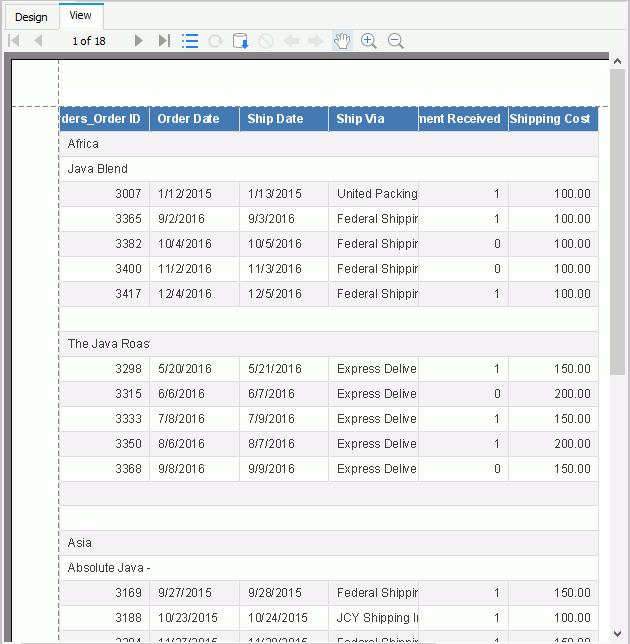
The required report has been created, but it is cumbersome to locate the shipment details of specific territories. So our next task is to add web controls to the report so that end users can easily filter the results of the report.
Task 2: Add a Web Control to the Report
Web controls empower end users of interactive reports to easily modify the reports they are viewing, and are defined by a trigger event, such as select, and a resulting web action.
In this task, we add a Drop-down List web control to the page header panel of the report. End users can use it to filter the report records by territory.
- Select Page Header in the View ribbon to display the page header panel.
- In the Report Inspector, select the Page Header Panel node and change its Height property to 1.25.
- Navigate to Insert > Web Controls > Drop-down List to insert a web control into the panel.
- Right-click the web control and select Display Type from the shortcut menu.
- In the Display Type dialog box, select in the Value column and then select the ellipsis
 in it.
 - In the Insert Fields dialog box, select Customers_Territory in the DBField List box and select Insert to add it as value of the drop-down list.
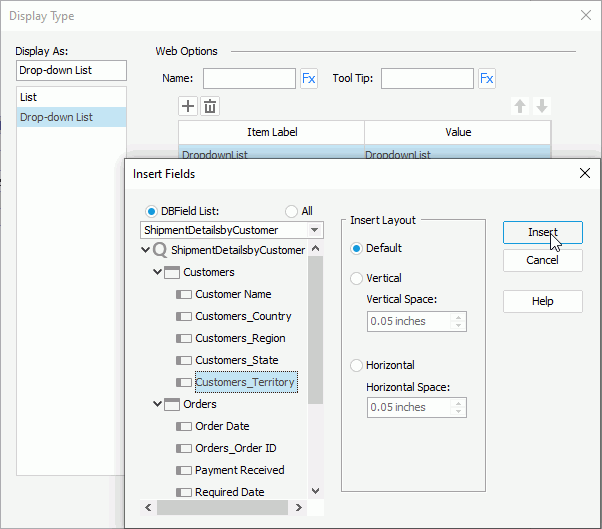
- In the Web Behaviors box of the Display Type dialog box, select Data Change from the drop-down list in the Events column, then select the ellipsis
 in the Actions column.
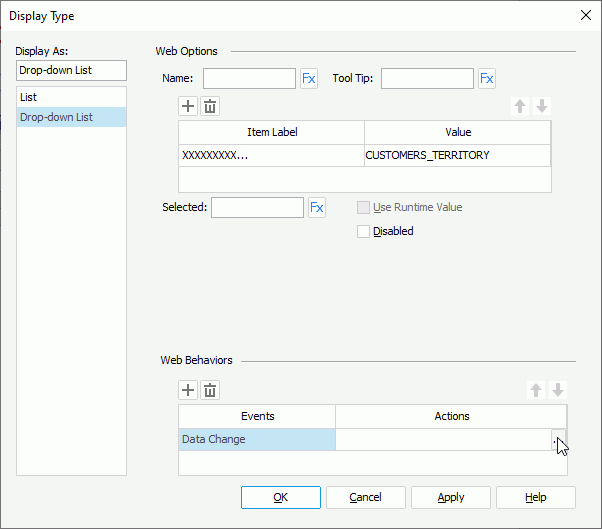
- In the Web Action List dialog box, select the *Filter action and select OK.
- In the Filter - Web Action Builder dialog box, specify to apply the action to TableComp, select in the Filter On column and select CUSTOMERS_TERRITORY from the drop-down list, then select in the Value column and select Multi-Value Container from the drop-down list. Select OK to apply the settings.
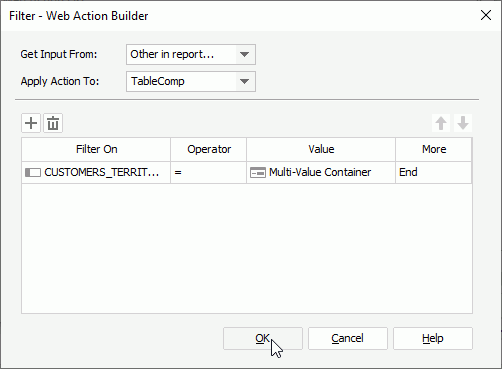
- Select OK in the Display Type dialog box to confirm the settings.
- Resize the drop-down list horizontally to display the territory name completely.
Task 3: Add Objects and Edit Properties
In this task, we want to add more labels in the report, one as the report title and the others for data identification. We also want to edit the properties of some objects to improve the report appearance.
- Drag the Label icon
 twice from the Components panel to the page header panel to add two labels in it.
 - Edit the text of the labels to Shipment Details by Customer and "Territory:".
- Resize the two labels and arrange the three objects in the page header panel as follows:

- Select the two labels and navigate to Format > Bold
 .
. - Select the Shipment Details by Customer label, then in the Report Inspector, set its Font Size property to 18 and Foreground property to Red.

- Resize the group-by fields in the two group header rows (GH), add two labels ahead of them and edit the text of the labels to "Territory:" for the first group-by field and "Customer Name:" for the second.
- Select the four objects in the two group header rows, then set their Bold property to true and Foreground property to 0xcc0000 in the Report Inspector.
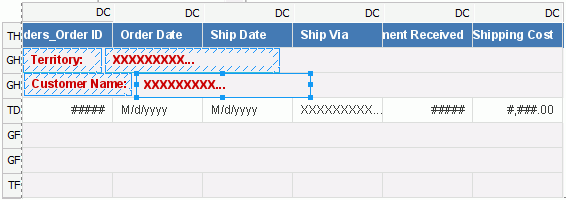
- Double-click the Orders_Order ID label in the table header row (TH) and edit its text to Order ID.
- Select the Ship Via label in the table header row and its DBField in the table detail row (TD), then resize them to make sure no data get truncated.
- Resize the Payment Received label and its DBField in the same way.
Next, we apply a different background color to the two group header rows and hide the second group footer row to improve the appearance and layout of the report.
- In the Report Inspector, select the Table Comp node from the report structure tree and set its Include Header and Footer property to false to disable alternating color for the table headers, group headers, and group footers, so that we can customize the color for the group headers.
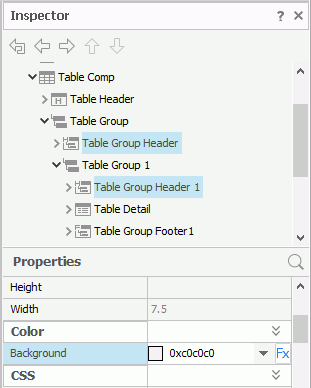
- In the Report Inspector, select the Table Group Header and Table Group Header 1 nodes in the report structure tree, then set their Background property to 0xc0c0c0.
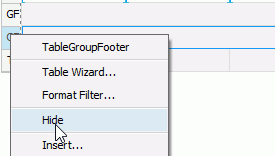
- Right-click on the second group footer row (GF) and select Hide from the shortcut menu to hide it.
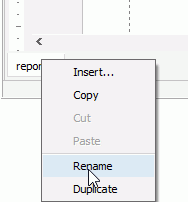
- On the report tab bar, right-click the report tab and select Rename to rename it to ShipmentDetails.
- Navigate to File > Save to save the report as ShipmentDetailsbyCustomer.cls.
- Select the View tab to preview the report.
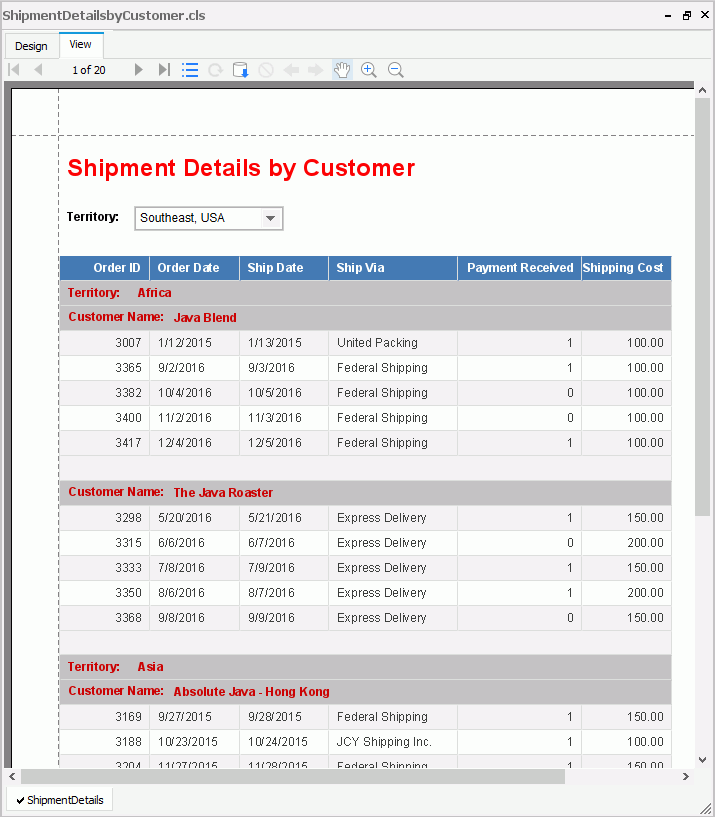
 If the report does not look correct, you can compare it to the final version of the report included in Designer. To do this, save and close your current catalog, and then open the JinfonetGourmetJava.cat catalog file in
 <install_root>\Demo\Reports\TutorialReports.
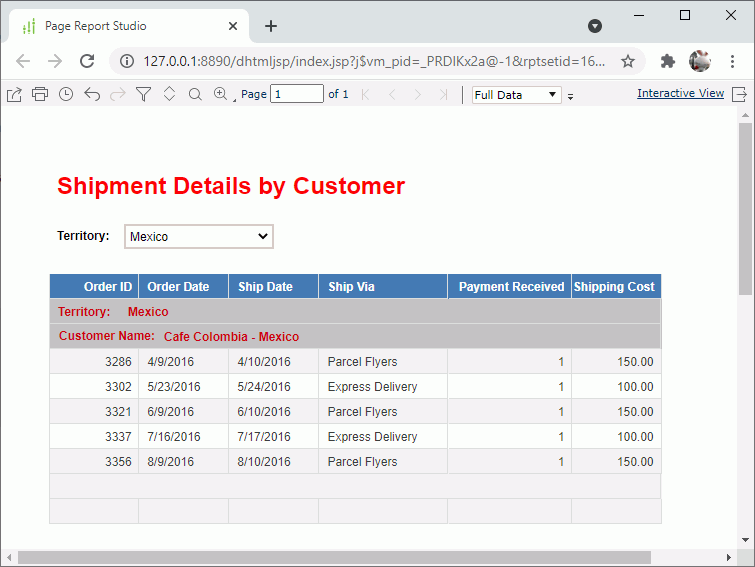
The web controls are powered by Page Report Studio and therefore cannot work in Designer. You can use the Preview as Page Report Result command of Designer to preview this report. However, this command is enabled only if you have selected the Server for Previewing Reports option when installing Designer.
Navigate to View > Preview As > Page Report Result. The report runs in Page Report Studio in your default web browser. Now you can select value from the drop-down list to dynamically change the report. In the following report, we choose to view records in the Mexico territory.
You can go to Creating and Performing Data Analysis on Page Reports in the Quick Start part to get more information about working with Page Report Studio.
 Previous Topic
 Back to top