Developing Reports from Hierarchical Data Sources
You can use hierarchical data sources to create page reports only. This topic presents two examples to show how you can develop reports from HDS.
When you use hierarchical data sources to create reports, you need to be aware of its limitations and unique features. For example, reports created from an HDS are automatically grouped, and you cannot directly use an HDS to create charts and crosstabs. That is to say, if you want to create a chart or crosstab from an HDS, you need to put it in a banded object created on the HDS, and make the chart/crosstab inherit the dataset of the banded object.
This topic contains the following sections:
- Example 1: Developing a Report from an HDS with Dynamic XML URI
- Example 2: Developing a Report from a Parallel HDS
Example 1: Developing a Report from an HDS with Dynamic XML URI
- Make sure SampleReports.cat is the currently open catalog file. If not, navigate to File > Open Catalog to open it from
<install_root>\Demo\Reports\SampleReports. - In the Catalog Manager, expand the data source to which to add the HDS.
- Right-click the Parameters node and select New Parameter from the shortcut menu.
- In the New Parameter dialog box, specify a name for the parameter, choose String as the value type, and specify the URI of the XML file from which to import the HDS as the prompt value (for more information about creating parameters, see Creating a Parameter).
- Right-click the data source node in the Catalog Manager, and then select New XML Hierarchical Data Source.
- In the New XML Hierarchical Data Source dialog box, type @ParameterName in the XML URI box. For example, if you named the parameter in step 2 as "XML_URI", here you should type @XML_URI. In the XSD URI box, specify the URI of the corresponding XSD file. Select OK to add the HDS.
- Create a page report with the imported HDS. When you view the report, specify the URI of the XML file which matches the XSD file in the parameter. The report then shows the corresponding data.
You can also use another way to develop report with dynamic XML URI as follows:
- In the Catalog Manager, import an XML HDS with an XSD file, and then create a report with the imported HDS.
- Create a parameter as described in the previous procedure.
- In the Catalog Manager, go to the node of the imported HDS, expand the Properties sheet, and then change the property URI to @ParameterName.
- Now you can view the report with dynamic XML file.
Example 2: Developing a Report from a Parallel HDS
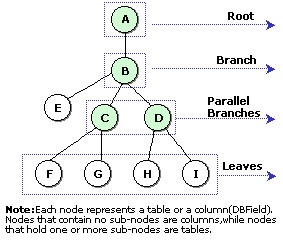
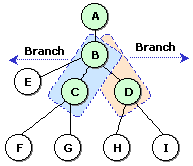
Data in a parallel HDS is organized in a tree structure, which contains branches and leaves. Among these branches, there are some parallel branch nodes that split the trunk of the data source tree into deeper and more complex branches. The following image illustrates the parallel HDS structure.

- Leaf
A leaf in parallel HDS refers to a column (DBField), nodes that contain no subnodes. - Branch
A branch in parallel HDS is a special table that contains leaves or subbranches.
- Parallel branches
When the content of two branches has no parental relationship, these branches are parallel branches.
The way of using a parallel HDS is the same as with general HDS in Designer. However, you should take note of the following when building reports from parallel HDSs.
Groups in parallel HDS
When you insert a group-by field, Designer inserts its children too.
The parallel structure in the parallel HDS is represented as groups in Designer, so when you develop a report from a parallel HDS, Designer automatically groups the report. By default, Designer uses the first found field as the group-by field. Note that you can neither add a new group-by field nor remove the group-by fields Designer adds automatically. However, if there is more than one field available to with which to group the subtables, you can replace the group-by field with one of the other available fields.
Rules for inserting an object
- You should place objects in different branches in the banded object panels they belong to, meaning, a banded object panel cannot hold objects which belong to different branches.
- You can insert the children of a branch, including the columns, formulas, summaries, subbranches, and children of the subbranches, into any of their parent panels. If the parent panel is shared by more than one branch, that is, if the parent panel works as a trunk (global panel), it can be shared by the children of all the branches it holds. However, note that each instance of a panel, such as a report/page/group header/footer panel, and detail panel, can only hold the children from the same branch. If you want to insert the children of different branches into the shared global panel, you need to create as many instances of this panel as per the number of branches, and then insert the children of each branch into these panels.
- Where you can insert a formula/summary depends on the branch attributes of the formula/summary. When a formula/summary creates relationships with a column, it obtains the same branch attributes as those of the related column, and you can place it in the panels where you can place the column.
You can place a global formula, which is not associated with any branch columns, to any position of the report.
- When you remove a branch using the component wizard, Designer also removes the related panel.
- You can only place a chart that is based on a field in its own panels, which include most of the global panels, except for the detail panel.
- You should create a crosstab upon data of the same branch, and you should place the crosstab in the location where the branch data resides.
- Where you can insert a text box object depends on the branch attributes of the columns (formulas/summaries) that it contains. A text box object can hold only the data of the same branch.
![]()
- Since reports created from HDS are automatically grouped, in the Group screen of the banded wizard, you can neither add more groups by fields nor remove the existing ones. However, you can make changes to the existing group criteria. For example, you can replace a group-by field with another one.
- When you want to publish reports created from XML hierarchical data sources to Server, the following method is recommended:
- In the Catalog Manager, select the HDS that is used by the report from the Hierarchical node, and then expand the Properties sheet.
- Change the URI property of the HDS to a relative path, for example, leaving only the name of the XML file.
- Create a new folder, and copy the report, the catalog, the XML file, and the XSD file (if any) to the newly created folder.
- Navigate to File > Publish > Publish Report to Server to publish the folder (for more information, see Publishing Resources Remotely).
- Start Server. You are now able to run the report on it.
 Previous Topic
 Back to top