 Previous Topic
Embedding Data Components in a Banded Object
You can embed data components, including banded objects, tables, charts, crosstabs, and geographic maps inside a banded object. The embedded data components can have their own datasets or inherit the dataset from the parent, and when they inherit the parent's dataset, the report becomes powerful. This topic describes how you can use this unique Embedding Data Component feature of banded objects to design powerful reports.
For example, if you want Designer to filter a child data component automatically by the group of the parent banded object, you can put the child data component in the group panel in the banded object and make it inherit dataset from its parent, then Designer replicates the child data component for each group in the parent. Moreover, by embedding a chart in a banded object and having it inherit the dataset from the parent, you can make the chart a dynamic chart in Excel. However, when you want to insert a data component into the Detail (DT), Banded Page Header (BPH), or Banded Page Footer (BPF) panel of a banded object, you cannot make the data component inherit dataset from the parent.
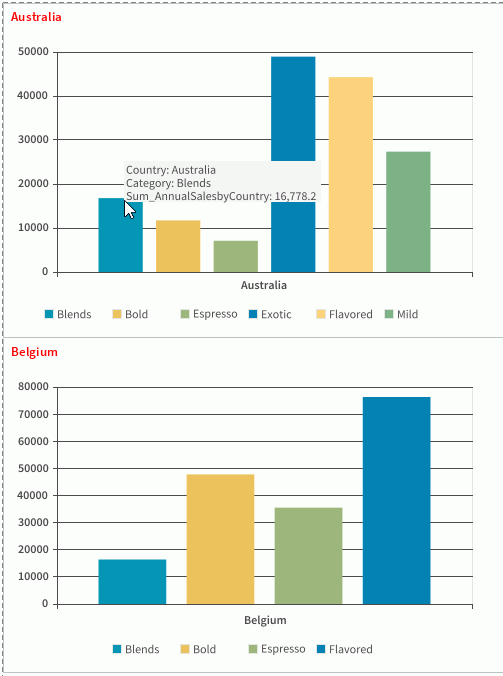
The following example shows how you can create a report to deliver a chart to each country to show the annual sales of each product category for the country.
- Make sure SampleReports.cat is the currently open catalog file. If not, navigate to File > Open Catalog to open it from
<install_root>\Demo\Reports\SampleReports. - Navigate to File > New > Page Report to
create a page report with a banded object in its first report tab. The banded object applies the query WorldWideSales in Data Source 1 of the catalog and is grouped by the field Country.
- Select the Country group-by field, then in the Report Inspector, set its Foreground property to 0xff0000 and Bold property to true.
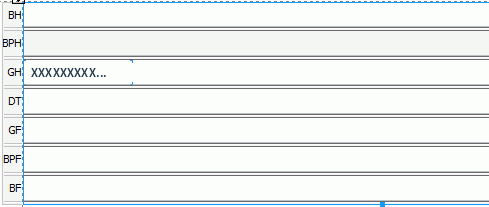
- Right-click the banded header panel (BH) and select Hide from the shortcut menu to hide it.
- Hide the panels BPH, DT, GF, BPF, and BF that do not contain any data in the same way.
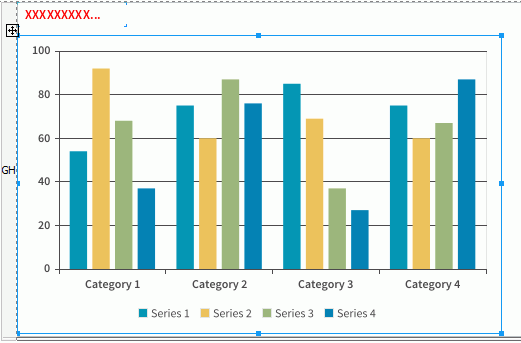
- Resize the group header panel (GH), then insert a Clustered Bar 2-D chart to the panel below the Country group-by field. The chart inherits the dataset from the banded object (make sure to select Current Dataset in the Data screen of the Create Chart dialog box), and displays the summary Sum_AnnualSalesbyCountry on the value axis and the DBField Category on the series axis (Designer adds the field Country automatically to the category axis).
- Save the report and select the View tab to preview it. Designer filters the annual sales for each product category in each country in the chart according to the group-by field Country in the banded object.
 Back to top