 Previous Topic
Creating Scrollable Charts
In a scrollable chart, values displaying in the chart are not fixed. A scroll bar in the scrollable chart can help you control the visible value range on the category axis of the chart. This is often used where the category axis is a date or a time such as stock quotes. However, you can use it with any type of value. Any time the number of categories may become too large to be easily identified on the screen, consider adding a scrollable option. This topic shows how you can edit a chart to become a scrollable chart.
You can create scrollable charts from charts of the 2-D Bar, Bench, Line, and Area types in web reports and library components only.
To make a bar, bench, line, or area chart scrollable
- Right-click any element of the chart and select Scrollable Chart from the shortcut menu. Designer displays the Scrollable Chart dialog box.
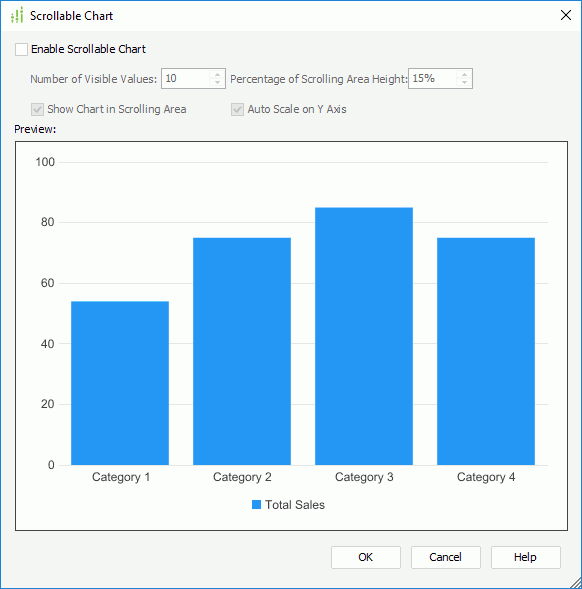
- Select Enable Scrollable Chart to use a scroll bar to control the number of visible values on the category axis.
- Specify how many data items are selected on the scroll bar and display on the category axis by default in the Number of Visible Values box, then specify the percentage the scroll bar occupies the whole size of the chart.
- Specify whether to show the thumbnail chart on the scroll bar.
- Specify whether to recalculate the scale of the value (Y) axis when the value of the Number of Visible Values option is changed.
- Select OK to apply the settings for the chart.
Example: Creating a Scrollable Chart
- Make sure SampleReports.cat is the currently open catalog file. If not, navigate to File > Open Catalog to open it from
<install_root>\Demo\Reports\SampleReports. - Navigate to File > New > Web Report to create a web report.
- Insert a chart in the web report as follows:
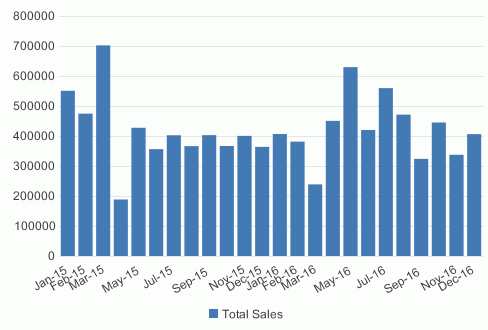
- Use WorldWideSalesBV in Data Source 1 of the catalog.
- Display in the Clustered Bar 2-D chart type.
- Show Sales Month on the category axis and Total Sales on the value axis.
- Apply the Classic style.
- Save the report and select the View tab to preview the chart.
- Select the Design tab to return to design mode.
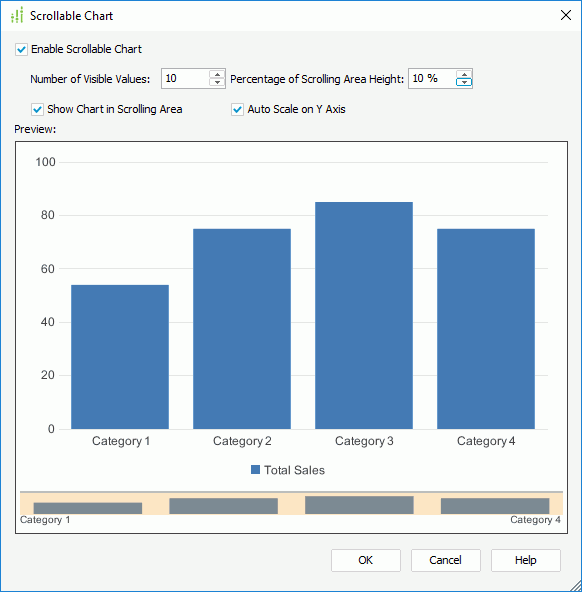
- Right-click on any bar and select Scrollable Chart from the shortcut menu.
- In the Scrollable Chart dialog box, select Enable Scrollable Chart, set Number of Visible Values to 10 and Percentage of Scrolling Area Height to 10%.
Keep the other two options selected and select OK to apply the settings and close the dialog box.
- Save the report.
- Navigate to View > Preview As > Web Report Result to run the report in Web Report Studio.
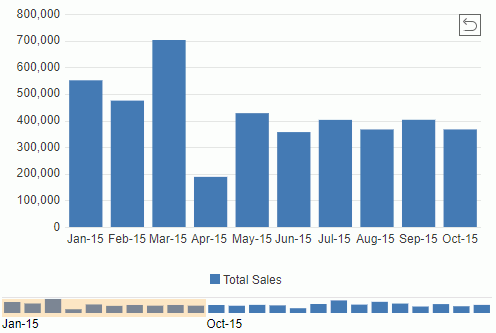
- We can see only 10 total sales values on the chart. To change the data items displaying on the X axis, drag the highlighted section on the scroll bar, or resize the width of the section by dragging its left or right edge.
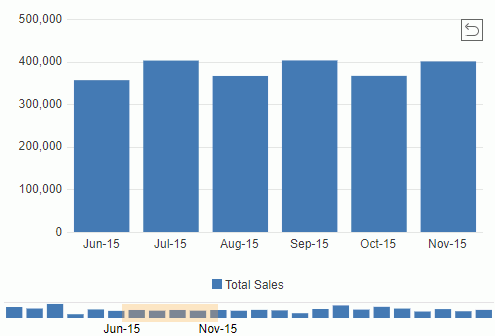
- To go back to the initial state of the chart, select the arrow at the upper right corner of the chart paper.
 When you export a scrollable chart to any format, the scrolling function is not available. In the output result, the chart only displays the values that are selected at the time when you export the report.
 Back to top