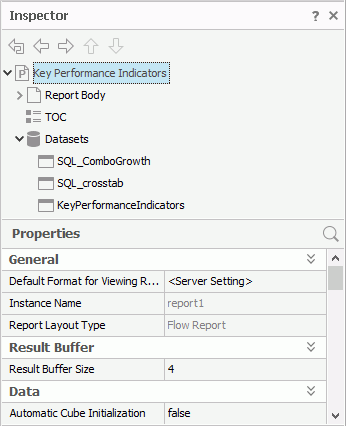
Inspector Panel
The Inspector panel, also referred to as the Report Inspector, lists all the objects a report contains in a tree structure (to display the panel, navigate to Home/View > Inspector). You can edit the object properties in the panel to change the appearance of your report. This topic introduces the usages of the toolbar buttons, report structure tree, and Properties sheet that comprise the panel.

Toolbar
The toolbar contains the following buttons:
-
 Home
Home
Select to show the main structure nodes of the web report or the current report tab for a page report in the report structure tree, which includes Report Body, TOC, and Datasets (only for page report tab). -
 /
/ Back/Forward
A page report contains one or more report tabs, and each report tab contains a report body. By default, the root node in the report structure tree represents the current report tab. You can use the two buttons to show one of the three levels as the root node: the report, report tab, or report body. For a web report, you can use the buttons to show the web report or report body as the root node. -
 /
/ Up/Down
You can use the two buttons to adjust the display sequence of the report objects in the report structure tree, which you can apply as tag order of the objects in the accessible PDF output of the report.
Report structure tree
Designer lists all the objects in the current report in a tree structure.
By selecting an object in the tree, you also select it in the report design area. When an object is invisible, you cannot see it in the design area but you can still select it from the tree and change it's Invisible property to "false". You can use "CTRL + select" and "SHIFT + select" to select multiple objects, then the Properties sheet shows only the properties that are common among the selected objects and you can change the property values for all the selected objects at a time. It is usually a much easier and faster way of selecting multiple objects in the tree than trying to select them one by one in the design area.
You can edit the display name of each object in this tree: select the object in the tree, after two or three seconds, select it again and the name becomes editable, then give the object a new name and select Enter on the keyboard to confirm. Users see the display name of data components such as banded objects, charts, crosstabs, and tables when they perform filter or sort at runtime. You may want to change the name of these objects, so users can easily understand which component they are choosing.
Properties sheet
This sheet lists all properties of the object that you select in the report structure tree. It has two columns: Name and Value. You can change how an object appears and behaves by changing its value in the Value column.
Each type of object has its own set of properties. Depending on the object type, the properties that a certain object holds can greatly differ from those of another. For more information about properties of each object, see Report Object Properties.
 Previous Topic
 Back to top