 Previous Topic
Crosstab Properties
You can use the Crosstab Properties dialog box to edit the properties of a crosstab. This topic describes the properties in the dialog box.
This topic contains the following sections:
OK
Select to apply any changes you made here and close the dialog box.
Cancel
Select to close the dialog box without saving any changes.
Help
Select to view information about the dialog box.
General Tab Properties
Specify the general properties of the crosstab.
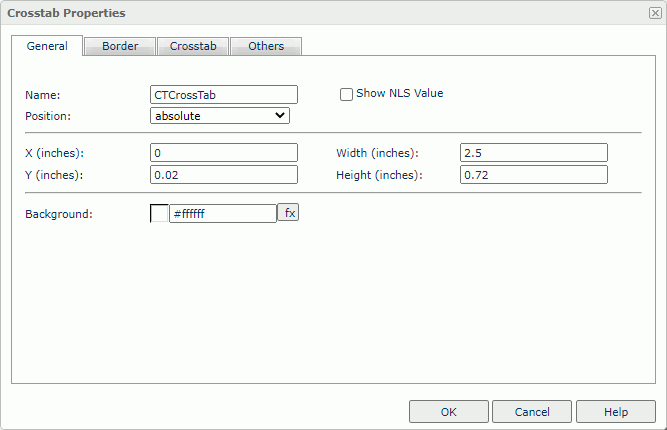
Name
Specify the display name of the crosstab.
Show NLS Value
Select to show the translated name for the display name of the object in the Name text box if you have enabled the NLS feature and translated it, and when you have not modified the display name of the object.
Position
Select the position mode of the component when it is directly contained in the report body, a tabular cell, or a text box.
- absolute
Server locates the component at the position that you specify by dragging and dropping or by setting its X and Y coordinate property values. The component insertion point does not change, for instance, it is not affected when you insert text before it. The position of an object in a banded object can only be absolute. - static
Server positions the component at the location where you insert it. The X and Y coordinate properties are disabled. You cannot move the component to another position other than by moving its insertion point. This can happen when the text flow preceding the insertion point expands. - relative
Server positions the component at an offset to the position at which you insert it. The offset is determined by the X and Y coordinate property values. This value is not available for some types of components. Server displays relative in the default value list for the Position option, when the current position is relative. However, relative is no longer available in the value list after you apply static or absolute and reenter the dialog box.
X
Specify the X coordinate of the crosstab, in inches.
Y
Specify the Y coordinate of the crosstab, in inches.
Width
Specify the width of the crosstab, in inches.
Height
Specify the height of the crosstab, in inches.
Background
Specify the background color of the crosstab.
To change the color, select the color indicator to access the Select Color dialog box, and then specify a new color. You can also type a hexadecimal RGB value to specify a color, for example, #9933ff. If you want to make the background transparent, type Transparent in the text box.
 Back to top
Border Tab Properties
Specify the border properties of the crosstab.
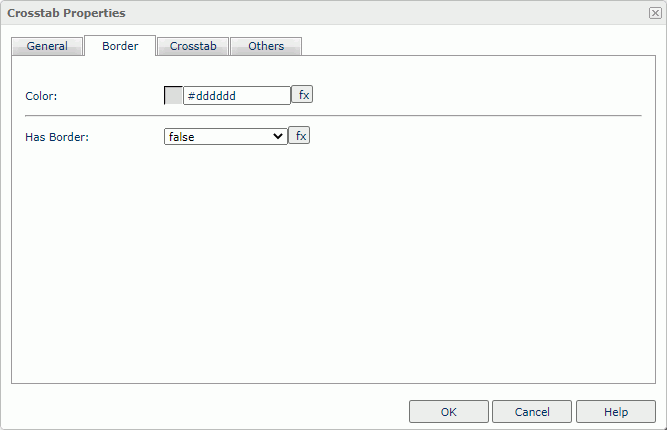
Color
Specify the color of the border.
To change the color, select the color indicator to access the Select Color dialog box, and then specify a new color. You can also type a hexadecimal RGB value to specify a color, for example, #9933ff. If you want to make the border transparent, type Transparent in the text box.
Has Border
Select true if you want to show the border.
Crosstab Tab Properties
Specify the layout properties of the crosstab.
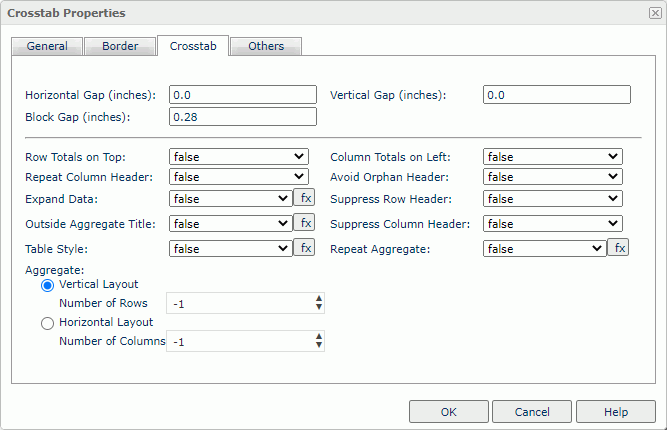
Horizontal Gap
Specify the space between the contents and the left/right edge of a crosstab cell.
Vertical Gap
Specify the space between the contents and the top/bottom edge of a crosstab cell.
Block Gap
Specify the spacing between each part of the crosstab if the crosstab splits into more than one part.
Row Totals on Top
Select true to display the Total row in the first row of the crosstab.
Column Totals on Left
Select true to display the Total column in the first column in the crosstab.
Repeat Column Header
Select true to repeat column headings on every page.
Avoid Orphan Header
Sometimes the column header happens to be at the bottom of a page. Select true if you want to keep the column header together with the data in the next page.
Expand Data
Select true if you want to expand or collapse dimensions in the crosstab.
Suppress Row Header
Select true to hide the row headers.
Outside Aggregate Title
Select true to place the titles of aggregate fields outside.
Suppress Column Header
Select true to hide the column headers.
Table Style
Select true to add headers to the Total rows and columns.
Repeat Aggregate
Select true to repeat the crosstab for different aggregate fields. For more information, see Repeat Aggregate in the Report Designer Guide.
Aggregate
Specify the layout of the aggregate fields.
- Vertical Layout
Select to arrange the aggregate fields vertically.- Number of Rows
Specify the number of rows to hold the aggregate fields in the crosstab. By default, it is -1 which means that Server places each aggregate field in a row so that the aggregate fields are in one column vertically. Server treats a number equal to or larger than the number of aggregate fields in the crosstab as -1. If you set the number of rows (3 for example) less than the number of aggregate fields (6 for example), there will be 3 rows to hold the 6 fields with each row containing 2 fields.
- Number of Rows
- Horizontal Layout
Select to arrange the aggregate fields horizontally. When you have multiple aggregate fields in the crosstab, using horizontal layout can make the report more readable.- Number of Columns
Specify the number of columns to hold the aggregate fields in the crosstab. By default, it is -1 which means that Server places each aggregate field in a column so that the aggregate fields are in one row horizontally. Server treats a number equal to or larger than the number of aggregate fields in the crosstab as -1. If you set the number of columns (3 for example) less than the number of aggregate fields (6 for example), there will be 3 columns to hold the 6 fields with each column containing 2 fields.
- Number of Columns
Others Tab Properties
Configure some miscellaneous settings.
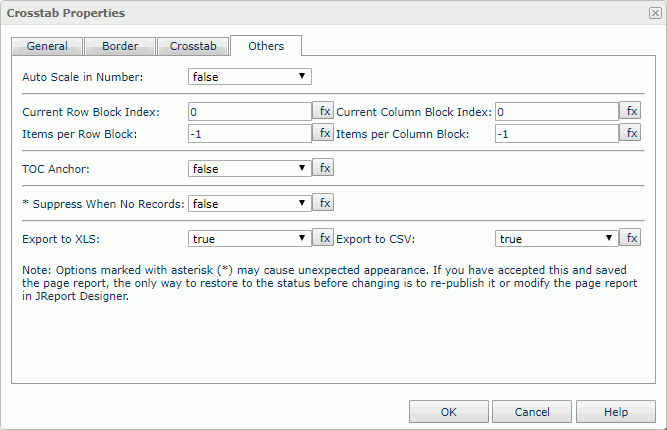
Auto Scale in Number
Select true if you want to automatically scale the values that are of the Number data type when the values fall into the two ranges:- When 1000 <= value < 10^15, Report uses the following quantity unit symbols of the International System of Units to scale the values: K (10^3), M (10^6), G (10^9), and T (10^12).
- When 0 < value < 0.001 or value >= 10^15, Report uses scientific notation to scale the values.
Current Row Block Index
Specify the vertical index of the data block. 0 means the first block index, 1 the second, and so on.
Current Column Block Index
Specify the horizontal index of the data block. 0 means the first block index, 1 the second, and so on.
Items per Row Block
Specify the number of rows in each data block.
Items per Column Block
Specify the number of columns in each data block.
The preceding four properties work together to control the data of the crosstab to display in the continuous page mode: Current Row Block Index, Current Column Block Index, Items per Row Block, and Items per Column Block.
TOC Anchor
Select true if you want to add the object to the TOC tree in the TOC Browser.
Suppress When No Records
Select true if you want to hide the object in the report when no record returns to its parent data component.
Export to XLS
Select true if you want to export the object when you save the report as an XLS file (make sure to check Data Format in the Export dialog box).
Export to CSV
Select true if you want to export the object when you save the report as a TXT file with Delimited Format.