 Previous Topic
Formatting Bullet Chart
This topic describes how you can format the bullets in a bullet chart.
- Right-click any bullet in the bullet chart and select Format Bullet from the shortcut menu, or double-click any bullet in the chart. Designer displays the Format Bullet dialog box.
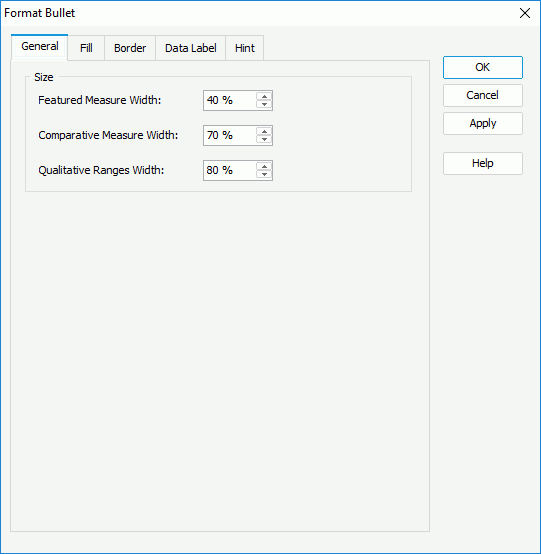
- In the General tab, specify the size of the bullets by setting the width of the featured measure, comparative measure, and qualitative ranges respectively.
- In the Fill tab, set the color pattern to fill the bullets.
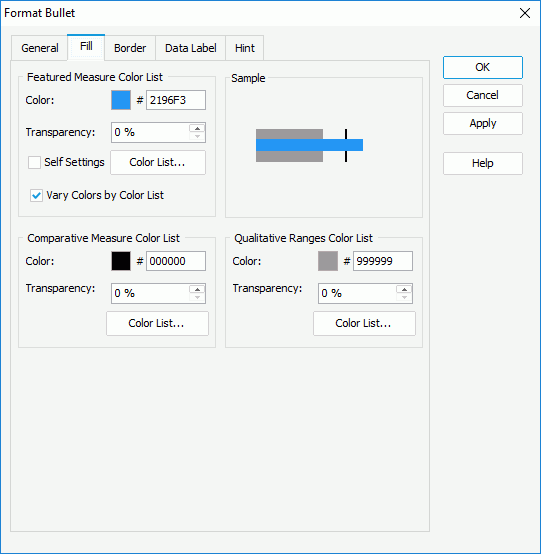
- In the Featured Measure Color List box,
- Specify whether to define the color pattern on the featured measures themselves by using the Self Settings option. When Self Settings is cleared (the default behavior), Designer synchronizes the color pattern that you specify here with the Pattern List property of the chart in the Report Inspector, which data markers of other subtypes can also apply if the chart is a combo chart. When you select Self Settings, it indicates that the color pattern is private to the current data markers themselves (the bullets in this case), which Designer remembers and applies to data markers of the new type automatically if you change the type of the chart later.
- Set the color and transparency to fill all the featured measures (to change the color, select the color indicator and select a color from the color palette, or type the hexadecimal RGB value of a color in the text box)
- If you want to apply different colors to the featured measures, select Vary Colors by Color List, then select Color List to specify the color pattern for each featured measure in the Color List dialog box.
- In the Comparative Measure Color List/ Qualitative Ranges Color List box, specify the color and transparency to fill the selected comparative measures/qualitative ranges in the same data series, or select Color List to specify the color pattern for comparative measures/qualitative ranges in the same data series respectively.
- In the Featured Measure Color List box,
- In the Border tab, select Show Border if you want to display border for the bullets, then specify the border properties.
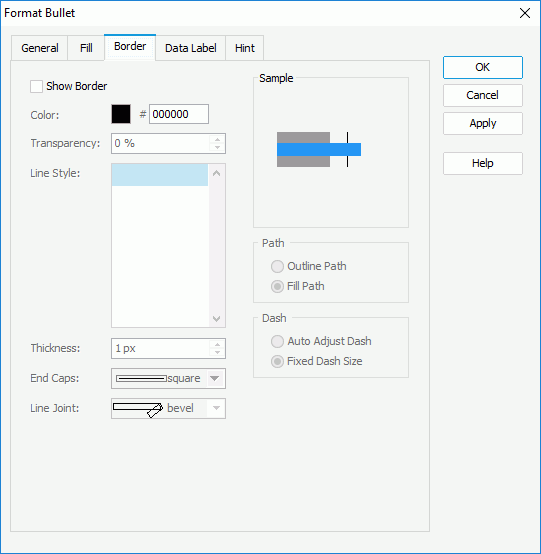
- Specify the color, transparency, line style, thickness, ending style, and line joint mode of the border.
- In the Path box, specify the fill pattern of the border: Outline Path or Fill Path.
- In the Dash box, select to automatically adjust the dash size or use fixed dash size if you select a dash line style for the border.
- Skip the Data Label tab because Designer does not support displaying data labels in bullet charts.
- In the Hint tab, specify properties of the chart hint. A hint displays the value a bullet represents when you point to the bullet in Designer view mode, in HTML output, or at runtime.
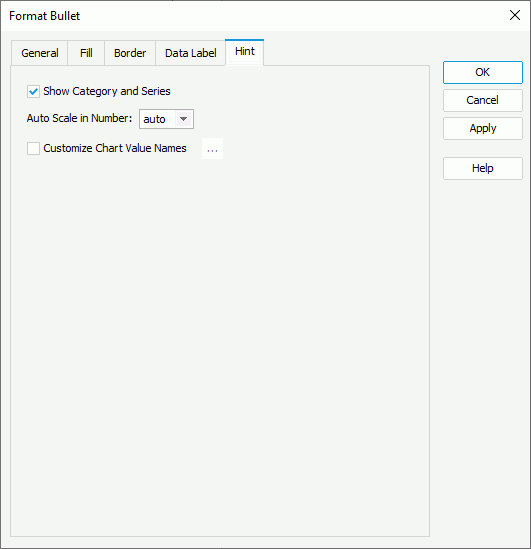
- Clear Show Category and Series if you do not want to include the category and series values in the hint.
- Specify whether to scale big and small numbers in the hint.
- Select Customize Chart Value Name to use customized names for the fields on the value axis in the hint and select the ellipsis
 to customize the names as you want.
 You should not edit the Show Tips property of the Chart Paper object in the Report Inspector which is "true" by default, if you want to display the hint.
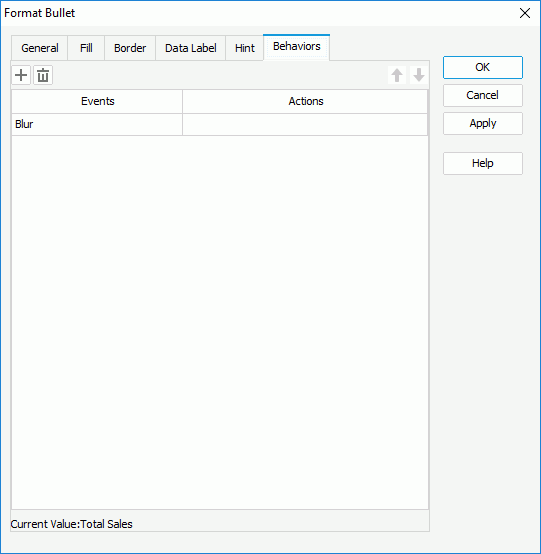
 - For a bullet chart in a library component, you can specify web behaviors for it in the Behaviors tab, to enable users to trigger different web actions when they perform specific operations such as Click and Mouse Over on the bullets at runtime.
- Select OK to accept the changes and close the dialog box.
 Back to top