 Previous Topic
Formatting Heat Map Rectangles
This topic introduces how you can format the rectangles and titles of the rectangles in a heat map.
This topic contains the following sections:
Formatting the Rectangles in a Heat Map
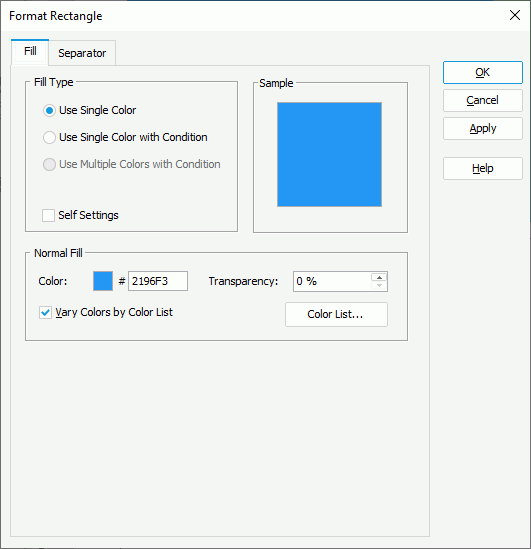
- When there is only one group in the heat map, right-click the heat map and select Format Rectangle on the shortcut menu. Designer displays the Format Rectangle dialog box.
When there are two or more groups in the heat map, right-click the heat map, then from the Format Rectangle submenu, select a group field. Designer displays the Format Rectangle dialog box for the group.
- In the Fill tab, specify the fill type and the color pattern to fill the rectangles.
- When you select the Use Single Color with Condition fill type, specify the conditions and the color pattern for each condition respectively. See Adding Conditional Color Fills to Charts.
- When you select the Use Single Color fill type,
- When the heat map is colored by one of the following cases: no field, 1 to n groups, or 1 to n groups and 1 summary,
- Make your choice for the Self Settings option. When Self Settings is cleared (the default behavior), Designer synchronizes the color pattern that you specify here with the Pattern List property of the chart in the Report Inspector, which data markers of other subtypes can also apply if the chart is a combo chart. When you select Self Settings, it indicates that the color pattern is private to the current data markers themselves (the rectangles in this case), which Designer remembers and applies to data markers of the new type automatically if you change the type of the chart later.
- Specify the color and transparency of the first rectangle (or all rectangles when the heat map has no color-by field) in the heat map (to change the color, select the color indicator and select a color from the color palette, or type the hexadecimal RGB value of a color in the text box).
- By default, Designer selects Vary Colors by Color List which means Designer fills each rectangle with a different color. You can select Color List to customize the color of each rectangle in the Color List dialog box.
- When the heat map is colored by a summary,
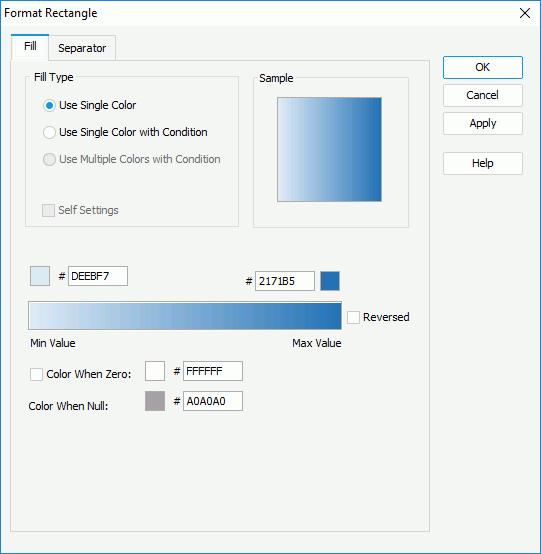
- Specify the starting color for the minimum value and ending color for maximum value of the summary respectively on the gradient color bar. To exchange the starting color and ending color, select Reversed.
- If you want to specify a color for the zero value, select Color When Zero and define the color accordingly, then the gradient changes from the starting color to the zero value color, and then from the zero value color to the ending color.
- You can also specify a color for the null value by setting Color When Null.
- When the heat map is colored by one of the following cases: no field, 1 to n groups, or 1 to n groups and 1 summary,
- In the Separator tab, specify the color, transparency, style, and thickness of the line separating the rectangles.
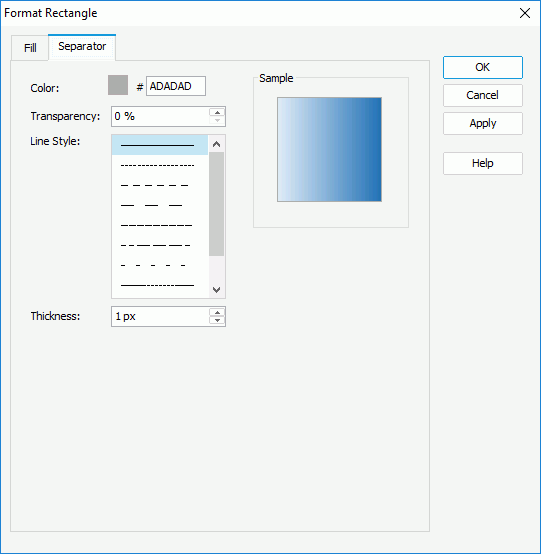
 You could get a bad layout in the preview result in Designer and in the report outputs, when you set the separator thickness to a big value.
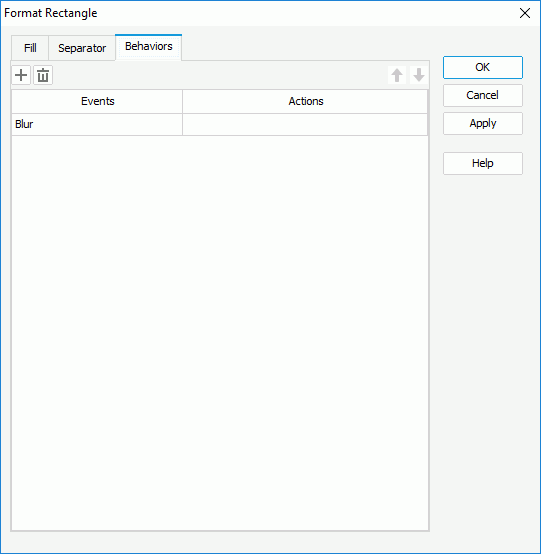
 - For a heat map chart in a library component, you can specify web behaviors for it in the Behaviors tab, to enable users to trigger different web actions when they perform specific operations such as Click and Mouse Over on the rectangles at runtime.
- Select OK to accept the changes and close the dialog box.
 Back to top
Formatting the Titles for Rectangles in a Heat Map
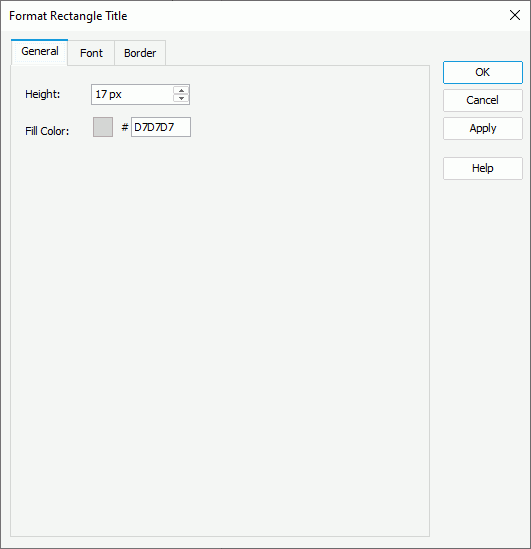
- When there is only one group in the heat map, right-click the heat map and select Format Rectangle Title on the shortcut menu. Designer displays the Format Rectangle Title dialog box.
When there are two or more groups in the heat map, right-click the heat map, then from the Format Rectangle Title submenu, select a group field. Designer displays the Format Rectangle Title dialog box for the group.
- In the General tab, specify the height and fill color of the rectangle titles (to change the color, select the color indicator and select a color from the color palette, or type the hexadecimal RGB value of a color in the text box).
- In the Font tab, specify font properties of the rectangle titles.
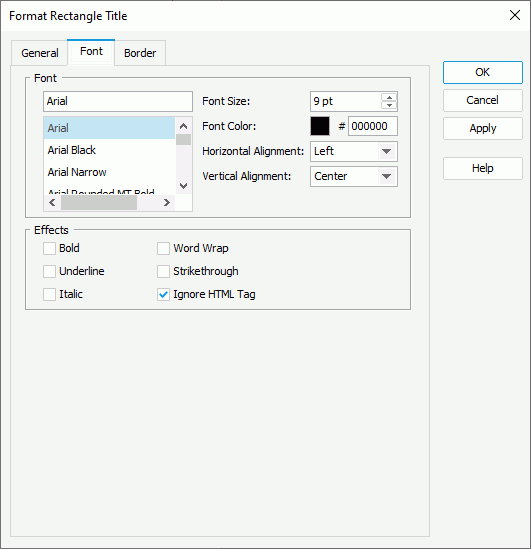
- In the Font box, specify the font face, font size, font color, and alignment of the rectangle titles.
- In the Effects box, apply some special effects to the rectangle titles, such as italicizing the titles and adding a horizontal line under the titles.
- By default, Report Engine ignores the HTML tag elements that are included in the rectangle titles at runtime and in HTML output, so they display exactly as what they are. Clear Ignore HTML Tag if you want Report Engine to transfer the HTML tag elements to the web browser, so they are translated into HTML by the web browser.
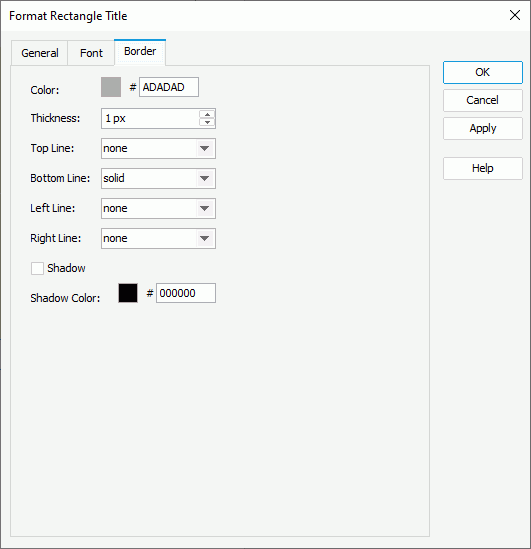
- In the Border tab, specify the color, thickness, line styles for the border of the rectangle titles; select Shadow to add a shadow effect to the border and specify the shadow color.
- Select OK to accept the changes and close the dialog box.