Editing Reports
You can modify a report at any time to make it better serve your requirements. In Designer, to edit a report is actually to edit the components in it. This topic introduces the general and common operations you can perform on the report components. For more information about working with different components, refer to the specific topic of each component in Components.
This topic contains the following sections:
- Inserting Components to a Report
- Duplicating Components
- Resizing Components
- Deleting Components from a Report
- Editing Component Properties
- Changing Component Position
- Applying Conditional Formatting in a Report
- Predefining Sort and Filter Conditions for Page Report Data Components
Inserting Components to a Report
After the initial design work of a report, you are also free to insert more components into it. To insert a component, you can either use the Insert ribbon or the Components panel.
Duplicating Components
You can duplicate any component in a report without creating it the second time.
To duplicate a component
- Select the component, then right-click the component and select Copy on the shortcut menu, or navigate to Home > Copy.
- Select in the destination where you want to place the component.
- Right-click the mouse and select Paste on the shortcut menu, or navigate to Home > Paste.
Resizing Components
- Select the component with the size you want to change. The sizing handles then appear along the four boundaries of the component.
- Drag a sizing handle to resize the component to the required size.
- Repeat the steps to resize other components.
Deleting Components from a Report
If you find any components contained in a report are not required, you can use either of the following two methods to remove it:
- In the Report Inspector, select the node which represents the component and select Delete on the keyboard.
- In the design area, right-click the component and select Delete from the shortcut menu.
Editing Component Properties
Each component has a set of properties that you can use to customize the appearance and behavior of the component.
To edit the properties of a component
- Select the component in the report or from the report structure tree in the Report Inspector.
- In the Properties sheet, modify the property values. See Report Object Properties for more information about the properties.
After editing the properties, you can save them as a CSS style for future use.
Changing Component Position
Report templates in Designer use a flow layout model, that is, paragraphs and components in the report body can flow from one page to another, maintaining their sequence, and the Position property controls whether a component is to be part of the flow, or separate from it. Besides the report body, tabular cells, text boxes, and KPIs themselves can also act as flow layout containers.
In a flow layout container, Designer positions the components relative to one another or absolutely based on their Position property value, which can be one of the following:
- Static
Designer positions the component at the location where you insert it. The X and Y coordinate properties are disabled. You cannot move the component to another position other than by moving its insertion point. This can happen when the text flow preceding the insertion point expands. - Relative
Designer positions the component at an offset to the position at which you insert it. The offset is determined by the X and Y coordinate property values. This value is not available for some types of components. - Absolute
Designer locates the component at the position that you specify by dragging and dropping or by setting its X and Y coordinate property values. The component insertion point does not change, for instance, it is not affected when you insert text before it. The position of an object in a banded object can only be absolute.When you set the Position property for components in the same flow layout container to "Absolute" and the components overlap, you can specify the display order of the objects by right-clicking an object and selecting an option from the Move submenu, or selecting the objects and selecting the corresponding move button in the Format ribbon.
 Move Backward
Select to move the component one step towards the back. Move to Back
Select to move the component to the back. Move Forward
Select to move the component one step closer to the front. Move to Front
Select to move the component to the front.
You can change the Position property of a component using these methods:
- In the design area, right-click the component and on the shortcut menu, select a command from the Position submenu.
- In the design area, select the component, then select the Format/Home ribbon and select an option from the Position drop-down list.
- In the Report Inspector, select the node that represents the component, then set its Position property.
In the same flow layout container, when components overlap, they follow the rule that the component inserted later covers the one earlier and the component with absolute position covers the one with static position. When different types of objects in a chart overlap, the covering order is: chart legend > chart label > chart paper or chart data label.
Applying Conditional Formatting in a Report
Conditional formatting enables you to highlight the values that are important in a report or users might need to act on at runtime.
You can apply conditional formatting to the following data fields in a report: DBField, Formula Field, Parameter Field, and Summary Field. For more information, see Adding Conditional Formatting to DBFields.
You can also apply conditional formatting to areas in shape maps and markers in geographic maps.
In a chart, you can add conditional color fills to apply different color patterns to its data markers based on different value ranges.
Predefining Sort and Filter Conditions for Page Report Data Components
For query-based page reports, you can predefine sort and filter conditions on the charts, tables, crosstabs, and banded objects in them, so that after you publish the page reports to Server and run them in Page Report Studio, these data components display data in the order you prefer, and narrow down to show only the data you desire.
![]() The predefined sort and filter conditions in a page report are based on the result set of all the other sort and filter conditions applied to the report. They also affects the preview result in Designer, and the result produced from being run in other formats besides Page Report Result.
The predefined sort and filter conditions in a page report are based on the result set of all the other sort and filter conditions applied to the report. They also affects the preview result in Designer, and the result produced from being run in other formats besides Page Report Result.
To predefine sort conditions in a page report
- Select a chart, table, crosstab, or banded object in the report.
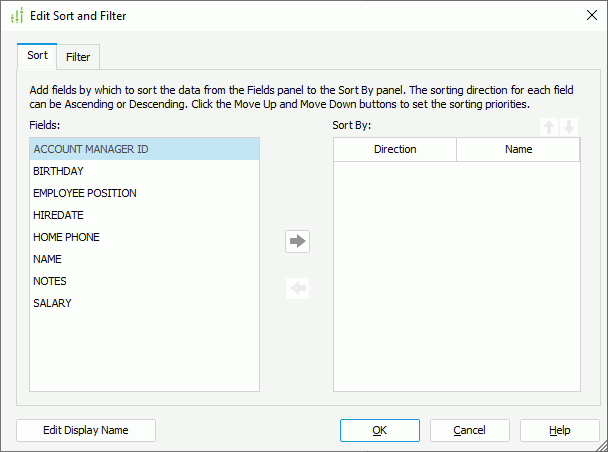
- Navigate to Report > Edit Sort & Filter. Designer displays the Edit Sort and Filter dialog box, and the Sort tab is active by default.

- The Fields box lists all the data fields in the dataset the data component uses. Select the fields by which to sort the data from the box and select Add
 to add them to the Sort By box.
  If you have not applied the Customize Display Name feature to the dataset the data component uses, no fields are available in the Fields box. In this case, select Edit Display Name to enable the feature on the dataset first.
 - To modify the sort direction for a field, select
 (ascending) or
  (descending) from the drop-down list in the Direction column.
 - To change the sort priority of the fields, select a field in the Sort By box, and then select Move Up
 or Move Down
  to move it higher or lower.
 - Select OK to accept the settings.
To predefine filter conditions in a page report
- Select a chart, table, crosstab, or banded object in the report.
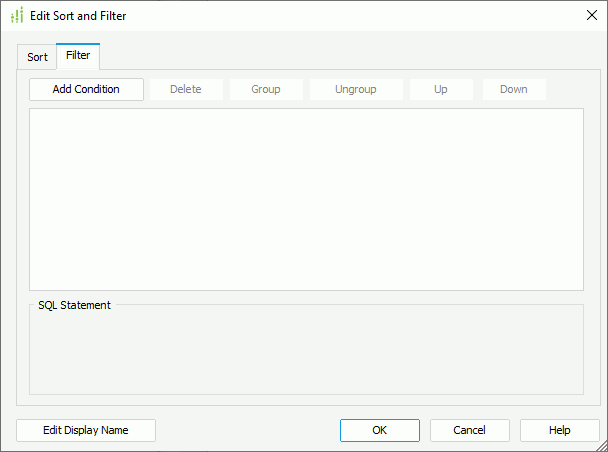
- Navigate to Report > Edit Sort & Filter. Designer displays the Edit Sort and Filter dialog box. Switch to the Filter tab.

- Select Add Condition to add a condition line.
- From the field drop-down list, select the field on which the filter condition is based.
 If you have not applied the Customize Display Name feature to the dataset the data component uses, no fields are available in the field drop-down list. In this case, select Edit Display Name to enable the feature on the dataset first.
 - From the operator drop-down list, choose the operator with which to compose the filter condition.
- In the value combo box, type the value of how to filter the field or select the value from the drop-down list. When the condition is based on a String field, you can apply an empty string as the value, by simply leaving the text box blank (value length=0).
- Repeat the preceding steps to define more condition lines and specify the logic relationship between the condition lines: "And", "Or", "And Not", or "Or Not".
- To group some condition lines, select them and select Group, Designer then adds the selected condition lines in one group and applies them as one line of filter expression (you can also group conditions and groups together).
- To take out any condition or group from a group, select it and select Ungroup.
- To adjust the priority of the condition lines, select it and select Up or Down.
- To delete a condition line, select it and select Delete.
- Select OK to save the condition.
 Previous Topic
 Back to top